Gridding
The CSO package contains a tool to creaste maps of retrieved or simulated satellite data on a regular grid.
The value assigned to a cell is a weighted average of the pixel values, where the weight is relative to the area of the overlapping part. Since a cell might be only partly covered by pixels, the normalization is done using the total overlapping area:
where:
\(i_k,j_k\) are the indices of grid cell \(k\);
\(P_k\) is the set of pixels that overlap with cell \(k\);
\(y_p\) is the data value of pixel \(p\);
\(w_p\) is the footprint area [m2] of pixel \(p\)
\(w_{p,k}\) is the area [m2] of pixel \(p\) that overlaps with the cell \(k\).
The overlapping area is computed using the LonLatPolygonCentroids method.
This fractions a footprint area into a large number of triangles, and returns
for each triangle the centroid and the area.
The centroids are collected per grid cell, and sum over the associated triangle area’s is
then used as measure for the overlapping area.
Create gridded fields
The CSO post processing tools could be used to create grid averages.
As described in the Step 9 - Gridded averages section, the configuration of the gridding job is:
! single step:
cso.tutorial.gridded.class        :  utopya.UtopyaJobStep
! catalogue creation task:
cso.tutorial.gridded.task.class   :  cso.CSO_GriddedAverage
cso.tutorial.gridded.task.args    :  '${PWD}/rc/tutorial-s5p.rc', \
                                      rcbase='cso.tutorial.gridded'
The actual work is done by the CSO_GriddedAverage class,
see its description for details on the configuration.
The result is a set of files with gridded averages:
CSO_output_20180601_0300_gridded.nc
CSO_output_20180601_0500_gridded.nc
CSO_output_20180601_0800_gridded.nc
:
Catalogue of gridded fields
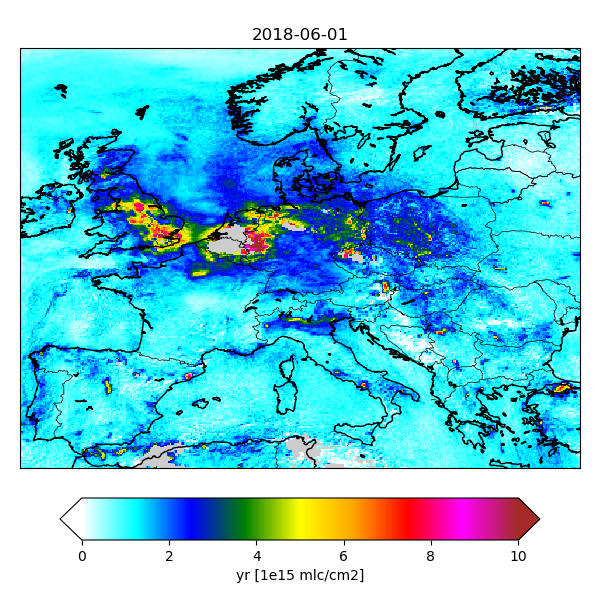
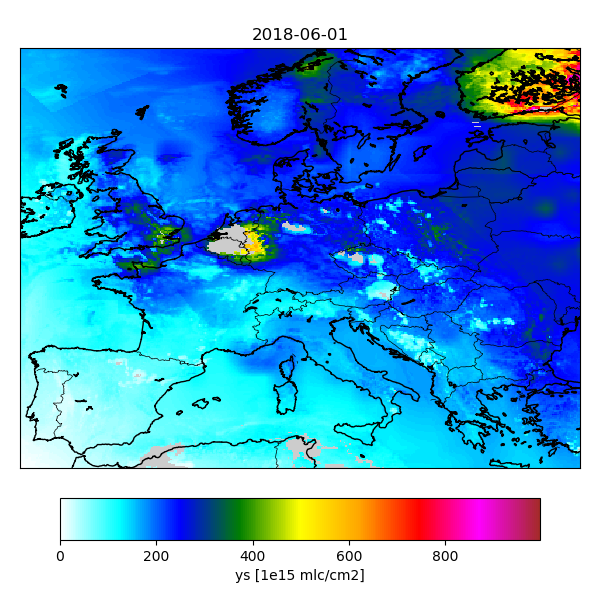
A catalogue of images of gridded fields could be made.
For the tutorial this is done using the cso.tutorial.gridded-catalogue job
that is configured as:
! single step:
cso.tutorial.gridded-catalogue.class           :  utopya.UtopyaJobStep
! two tasks:
cso.tutorial.gridded-catalogue.tasks           :  figs index
! catalogue creation task:
cso.tutorial.gridded-catalogue.figs.class      :  cso.CSO_GriddedCatalogue
cso.tutorial.gridded-catalogue.figs.args       :  '${PWD}/rc/tutorial-s5p.rc', \
                                                   rcbase='cso.tutorial.gridded-catalogue'
! indexer task:
cso.tutorial.gridded-catalogue.index.class     :  utopya.Indexer
cso.tutorial.gridded-catalogue.index.args      :  '${PWD}/rc/tutorial-s5p.rc', \
                                                   rcbase='cso.tutorial.gridded-catalogue-index'
The actual work is done by the CSO_GriddedCatalogue
and utopya.Indexer classes,
see their description for details on the configuration.
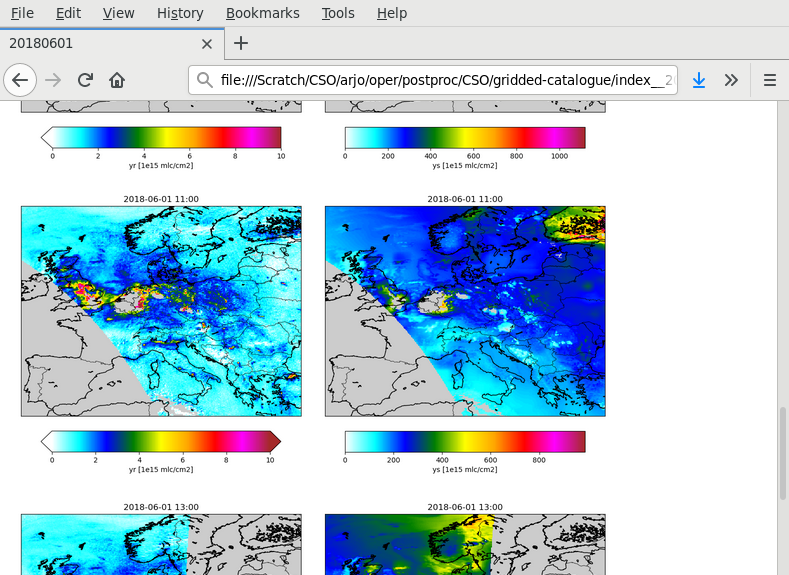
The result could be viewed in a browser:
Averages over time
The gridded fields have a time dimension, and therefore a temporal average could be produced using the NCO tools:
ncra CSO_output_20180601_??00_gridded.nc CSO_output_20180601_aver_gridded.nc
The result can be visualized using the catalogue tools.
Aggregations over regions
Tools are available to aggregate values over regions, for example countries.
See the cso_regions module for classes to create a country mask file,
and to create a catalogue of map plots zoomed to regions.